 scattermatrix.sas
/*
 * Richard A DeVenezia
 * January 9, 2004
 *
 * Output a matrix of scatter plots, plotting every pair of variables.
 * No by group processing.
 */

%macro scatterMatrix (

  data=
, vars=
, plotOptions=          %* options to appened to plot statement;
, axis=                 %* nothing or NOAXIS;
, goutemp=work.scatplot %* intermediate output catalog (is replaced during execution);
, gout=work.scatter     %* graphics output catalog;
, name=scatrix          %* output catalog entry name;
, vnfont=               %* font for variable name boxes;
, border=               %* color of treplay panel border;
, symvalue=plus         %* symbol in plots;
, hsize=8               %* inches;
, vsize=8               %* inches;
, forcesize=1           %* should plots be generated at the same size they will be replayed at?;
, honorTitles=1         %* should current title and footnote be honored and shown in a background slide?;
, honorAxis=0           %* set to 1 if you want to use axis statements you setup prior to calling this;
, haxis=axis1
, vaxis=axis1
, topGap=7.5            %* pct of slide in vertical direction reserved - if honoring and titles present;
, bottomGap=5           %* pct of slide in vertical direction reserved - if honoring and footnotes present;
, hGap=0                %* horizontal % between panels ;
, vGap=0                %* vertical % between panels ;

);

  %local i nvar;
  %local hasT hasF hpct vpct h_size v_size;
  %local j row col n panel row col lowerX upperX lowerY upperY;

  %*-----
  %* extract variable names from vars
  %* no checks are done to ensure each name is a column in data
  %*;

  %let i = 1;
  %do %while (%scan(&vars,&i) ne );
    %local var&i;
    %let var&i = %scan(&vars,&i);
    %let i = %eval(&i+1);
  %end;
  %let nvar = %eval(&i-1);

  %*-----
  %* generate background slide
  %*;

  goptions goutmode=replace nodisplay;

  %let hasT = 0;
  %let hasF = 0;

  %if (&honorTitles = 1) %then %do;

    proc gslide gout=&goutemp name="BG";
      goptions reset=note;
      note  " ";
    run;
    quit;

    goptions goutmode=append;

    proc sql;
      reset noprint;
      select sum(type='T')>0, sum(type='F')>0
      into :hasT, :hasF
      from dictionary.titles
      ;
    quit;

    %let topGap    = %sysevalf (&hasT * &topGap);
    %let bottomGap = %sysevalf (&hasF * &bottomGap);

  %end;
  %else %do;
    %let topGap = 0;
    %let bottomGap = 0;
  %end;

  %*-----
  %* create scatter plots
  %*;

  title;
  footnote;

  %put NOTE: TITLES and FOOTNOTES have been cleared.;

  %if (&honorAxis = 0) %then %do;

    axis1 major=none minor=none label=none value=none;

  %end;

  symbol1 v=&symvalue i=none;

  %*-----
  %* determine size of panels
  %*;

  %let hpct = %sysevalf ((100 - &hGap*(&nVar-1)) / &nVar);
  %let vpct = %sysevalf ((100 - &vgap*(&nVar-1) - &topGap - &bottomGap) / &nVar);

  %let h_size = %sysevalf (&hsize * &hpct/100);
  %let v_size = %sysevalf (&vsize * &vpct/100);

  %if (&forcesize) %then %do;

    goptions hsize=&h_size.in vsize=&v_size.in;

  %end;

  %*-----
  %* create scatter plots, pairing each variable
  %*;

  proc gplot data=&data gout=&goutemp;
    %do row = 1 %to &nvar;
    %do col = 1 %to &nvar;
      plot &&var&row * &&var&col
         / haxis=&haxis vaxis=&vaxis
           name="_&row._&col."
           &plotOptions
         ;
      run;
    %end;
    %end;
  quit;

  %*-----
  %* slides for var * var panel
  %*;

  goptions goutmode=append;

  %do row = 1 %to &nvar;
    proc gslide gout=&goutemp name="_&row";
      goptions reset=note;
      note move=(45pct,45pct) h=25pct
           %if %length(&vnfont) %then
           f=&vnfont
           ;
           "&&var&row"
      ;
    run;
  %end;
  quit;

  %*-----
  %* replay the plots and slides
  %* create an n x n panel template (tdef) and treply the plots into the panels;
  %*;

  goptions hsize=&hsize.in vsize=&vsize.in;
  goptions display;

  proc greplay nofs tc=&goutemp igout=&goutemp gout=&gout;

    tdef grid des="&nvar. x &nvar."

    %let panel = 0;
    %do row = 1 %to &nvar;

      %let lowerY = %sysevalf (100 - &topGap - &row*&vpct - (&row-1)*&vgap);
      %let upperY = %sysevalf (&lowerY + &vpct);

      %let lowerY = %sysfunc (round(&lowerY,0.01));
      %let upperY = %sysfunc (round(&upperY,0.01));

      %do col = 1 %to &nvar;
        %let lowerX = %sysevalf (0 + (&col-1)*(&hpct+&hgap));
        %let upperX = %sysevalf (&lowerX + &hpct);

        %let lowerX = %sysfunc (round(&lowerX,0.01));
        %let upperX = %sysfunc (round(&upperX,0.01));

        %let panel = %sysevalf (1 + &panel);

        &panel / llx=&lowerX lly=&lowerY
                 ulx=&lowerX uly=&upperY
                 urx=&upperX ury=&upperY
                 lrx=&upperX lry=&lowerY
                 %if %length(&border) %then
                 color=&border
                 ;
    %end;
    %end;
        0 / llx=0 lly=0 ulx=0 uly=100 urx=100 ury=100 lrx=100 lry=0
    ;
    template grid;
    treplay
    %let panel = 0;
    %do row = 1 %to &nvar;
    %do col = 1 %to &nvar;
      %let panel = %sysevalf (1 + &panel);
      %if &row=&col
        %then &panel "_&row.";
        %else &panel "_&row._&col.";
    %end;
    %end;
    %if (&honorTitles = 1) %then %do;
    0 "BG"
    %end;
    name="&name" ;
  run;
  quit;

%mend;
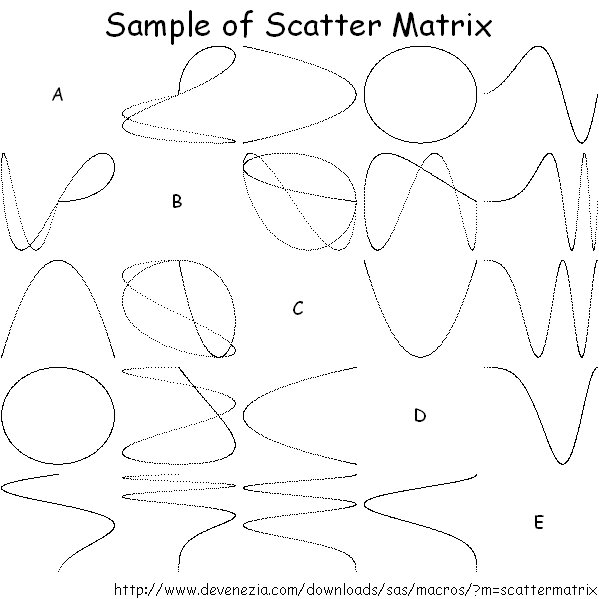
Sample code
options nosymbolgen;

options source mprint;

%let pi = %sysfunc (constant(PI));

data phony;
  n = 400;
  do x = 1 to n;
    a = sin (x/n*2*&pi);
    b = sin (x/n*4*&pi*x/n);
    c = cos (x/n*4*&pi);
    d = cos (x/n*2*&pi);
    e = sqrt(x);
    f = log(x);
    g = exp(x/n*2);
    h = sin(x/n*8*&pi)/(x/(n/4));
    i = ranuni(42)*2-1;
    j = x;
    output;
  end;
  drop n;
run;

ods listing ;

goptions ftext=Helvetica;
goptions ftext="Comic Sans MS";

goptions target=gif;
goptions device=gif;

goptions gsfname=gout;
filename gout "\\extreme\macros\scattermatrix.gif";

title h=7.5pct "Sample of Scatter Matrix";
footnote h=3.75pct j=r "http://www.devenezia.com/downloads/sas/macros/index.php?m=scattermatrix";

%scatterMatrix (
    data=phony
  , vars=A B C D E /*F G H I J*/
  , gout=scattered
  , name=showers
  , symvalue=point
  , bottomGap=4
  , forcesize=1
  , hsize=6.3
  , vsize=6.3
  , hgap=1
  , vgap=1
  , plotOptions = NOFRAME NOAXIS
);

options noxwait noxsync;

x "start %sysfunc(pathname(gout))"; 